A few weeks ago I discussed the book The First Steps in Seeing, in which the blackbody spectrum was plotted using a log-log scale. This got me to thinking, “I wonder how Fig. 14.24 would look if all axes were logarithmic?” The answer is shown below.
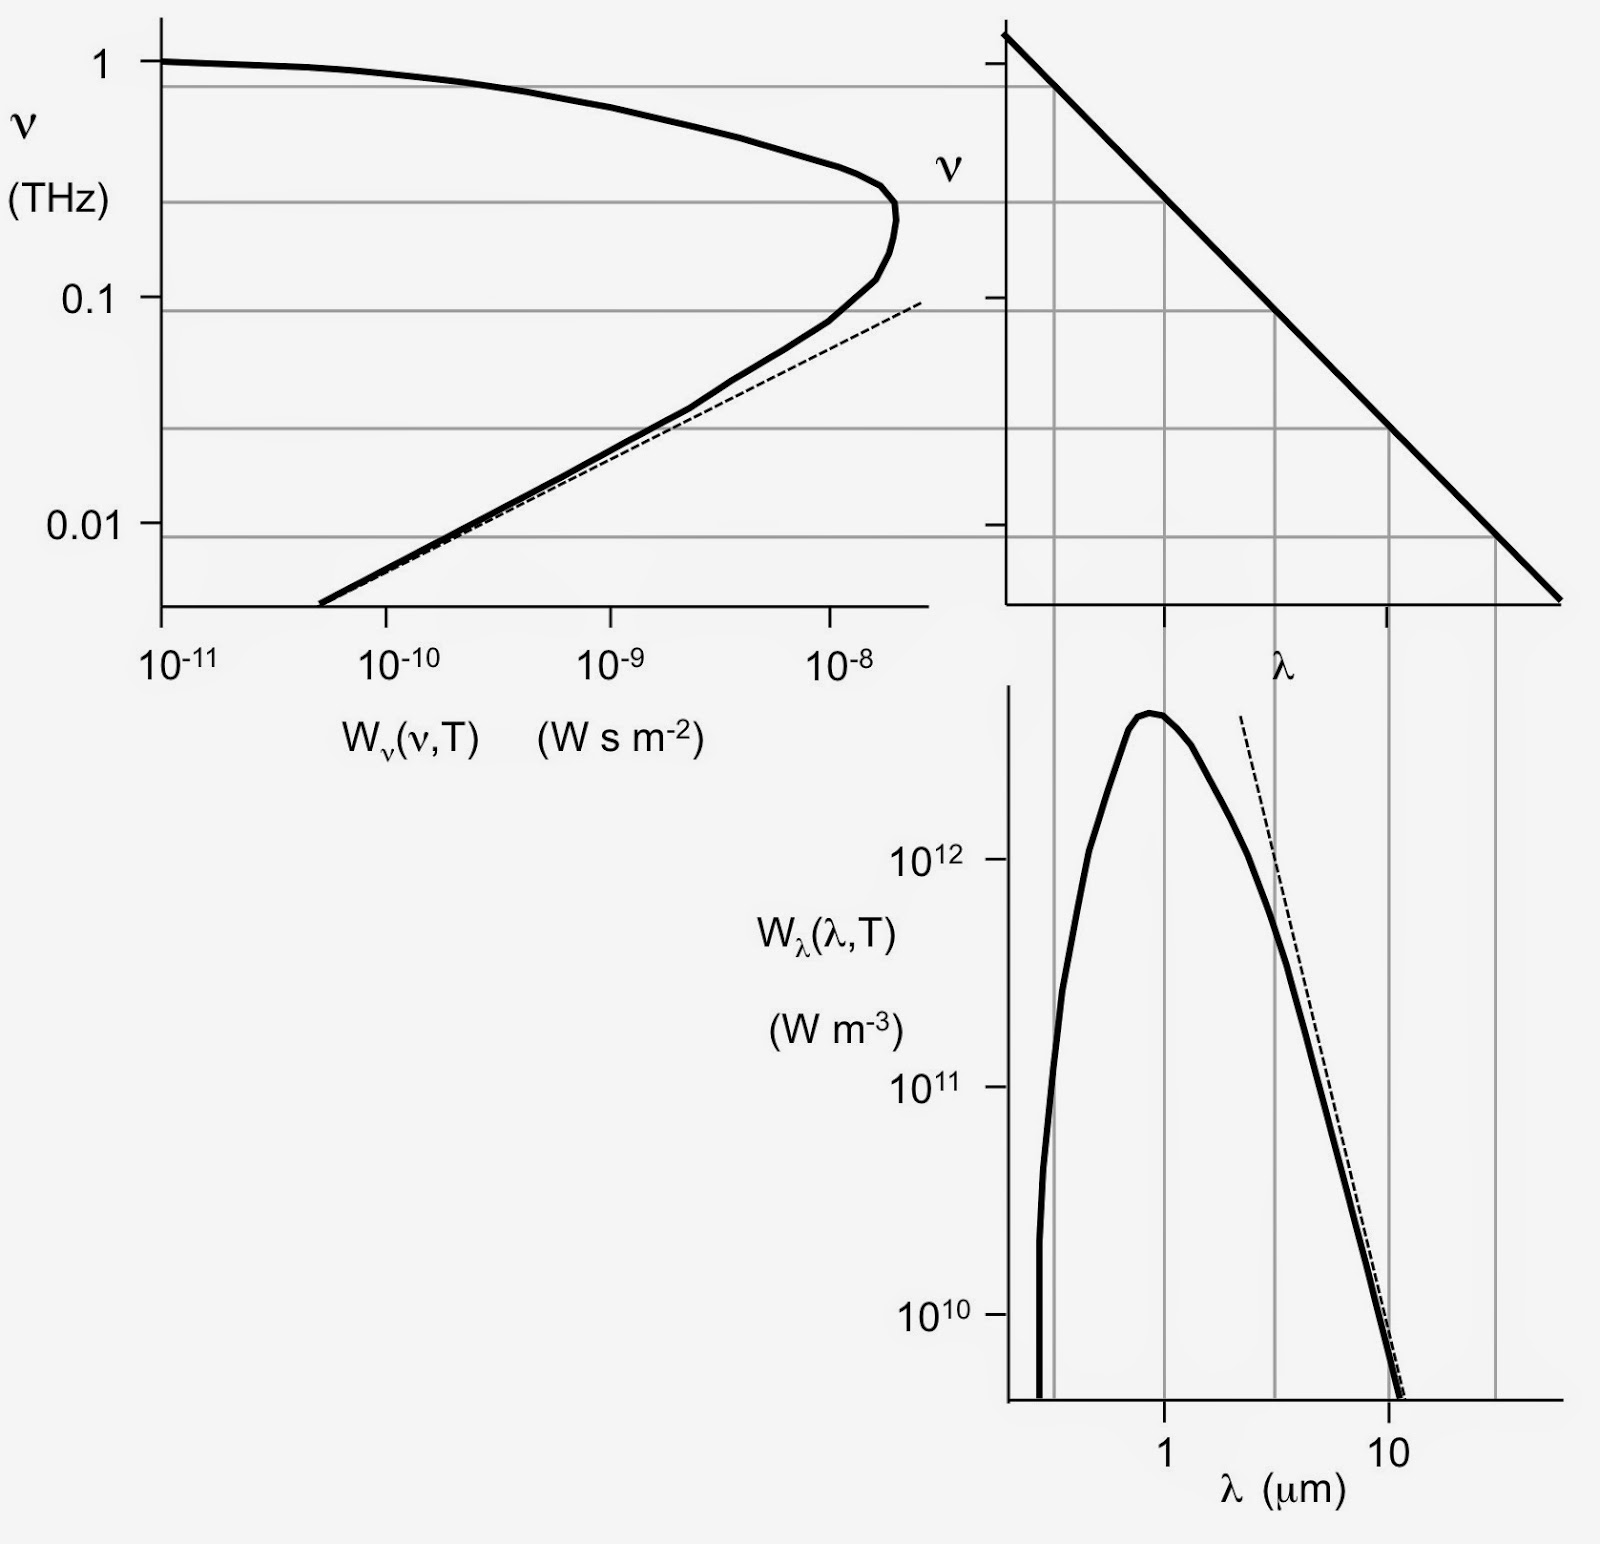 |
| Figure 14.24 from Intermediate Physics for Medicine and Biology, but plotted using a log-log scale. |
The bottom right panel of the above figure is a plot of Wλ versus λ. For this temperature the spectrum peaks just a bit below λ = 1 μm. At longer wavelengths, it falls off approximately as λ−4 (shown as the dashed line, known as the Rayleigh-Jeans approximation). At short wavelengths, the spectrum rises abruptly and is exponential.
The top left panel contains a plot of Wν versus ν. The spectrum peaks at a frequency just below about 0.3 THz. At low frequencies it increases approximately as ν2 (again, the Rayleigh-Jeans approximation). At high frequencies the spectrum falls dramatically and exponentially.
The connection between these two plots is illustrated in the upper right panel, which plots the relationship ν = c/λ. This equation has nothing to do with blackbody radiation, but merely shows a general relationship between frequency, wavelength, and the speed of light for electromagnetic radiation.
Why is it useful to show these functions in a log-log plot? First, it reinforces the concepts Russ Hobbie and I introduced in Chapter 2 of IPMB (Exponential Growth and Decay). In a log-log plot, power laws appear as straight lines. Thus, in the book’s version of Fig. 14.24 the equation ν = c/λ is a hyperbola, but in the log-log version this is a straight line with a slope of negative one. Furthermore, the Rayleigh-Jeans approximation implies a power-law relationship, which is nicely illustrated on a log-log plot by the dashed line. In the book’s version of the figure, Wλ falls off at both large and small wavelengths, and at first glance the rates of fall off look similar. You don’t really see the difference until you look at very small values of Wλ, which are difficult to see in a linear plot but are apparent in a logarithmic plot. The falloff at short wavelengths is very abrupt while the decay at long wavelengths is gradual. This difference is even more striking in the book’s plot of Wν. The curve doesn’t even go all the way to zero frequency in Fig. 14.24, making its limiting behavior difficult to judge. The log-log plot clearly shows that at low frequencies Wν rises as ν2.
Both the book’s version and the log-log version illustrate how the two functions peak at different regions of the electromagnetic spectrum, but for this point the book’s linear plot may be clearer. Another advantage of the linear plot is that I have an easier time estimating the area under the curve, which is important for determining the total power emitted by the blackbody and the Stefan-Boltzmann law. Perhaps there is some clever way to estimate areas under a curve on a log-log plot, but it seems to me the log plot exaggerates the area under the small frequency section of the curve and understates the area under the large frequencies (just as on a map the Mercator projection magnifies the area of Greenland and Antarctica). If you want to understand how these functions behave completely, look at both the linear and log plots.
Yet another way to plot these functions would be on a semilog plot. The advantage of semilog is that an exponential falloff shows up as a straight line. I will leave that plot as an exercise for the reader.
For those who want to learn about the derivation and history of the blackbody spectrum, I recommend Quantum Physics of Atoms, Molecules, Solids, Nuclei, and Particles (although any good modern physics book should discuss this topic). A less mathematical but very intuitive description of why Wλ and Wν peak at different parts of the spectrum is given in The Optics of Life. For a plot of photon number (rather than energy radiated) as a function of λ or ν, see The First Steps in Seeing.


No comments:
Post a Comment